Stop guessing. Start pricing with proof.
Rate QS turns every cost plan and BoQ your firm already owns into an AI-powered private benchmark library. Quantity surveyors get an immediate read on where rates sit, what outliers matter, and how to defend every estimate with data.
AI Cost Intelligence for QS Firms - Faster Insight, Smarter Estimates.
Upload a BoQ, let the model classify line items, and benchmark against your private history.
How Rate QS Works
From raw spreadsheets to interrogation-ready benchmarks in three focused steps.
Upload your BoQs
Drag and drop Excel or CSV files. No reformatting required. Rate QS reads multiple sheets and normalises quantity, unit, and total fields instantly.
AI classification
Our internal model assigns two-part keywords (Element; Descriptor) to every line, aligning with QS workflows and generating clean cost structures ready for benchmarking.
Interrogate your cost library
Benchmark rates, visualise trends, and switch from macro KPIs to line-level detail without leaving the dashboard. Share findings or export to Excel in one click.
Inside Rate QS
A purpose-built platform that transforms your historical cost data into actionable intelligence. See how Rate QS works in real-time.
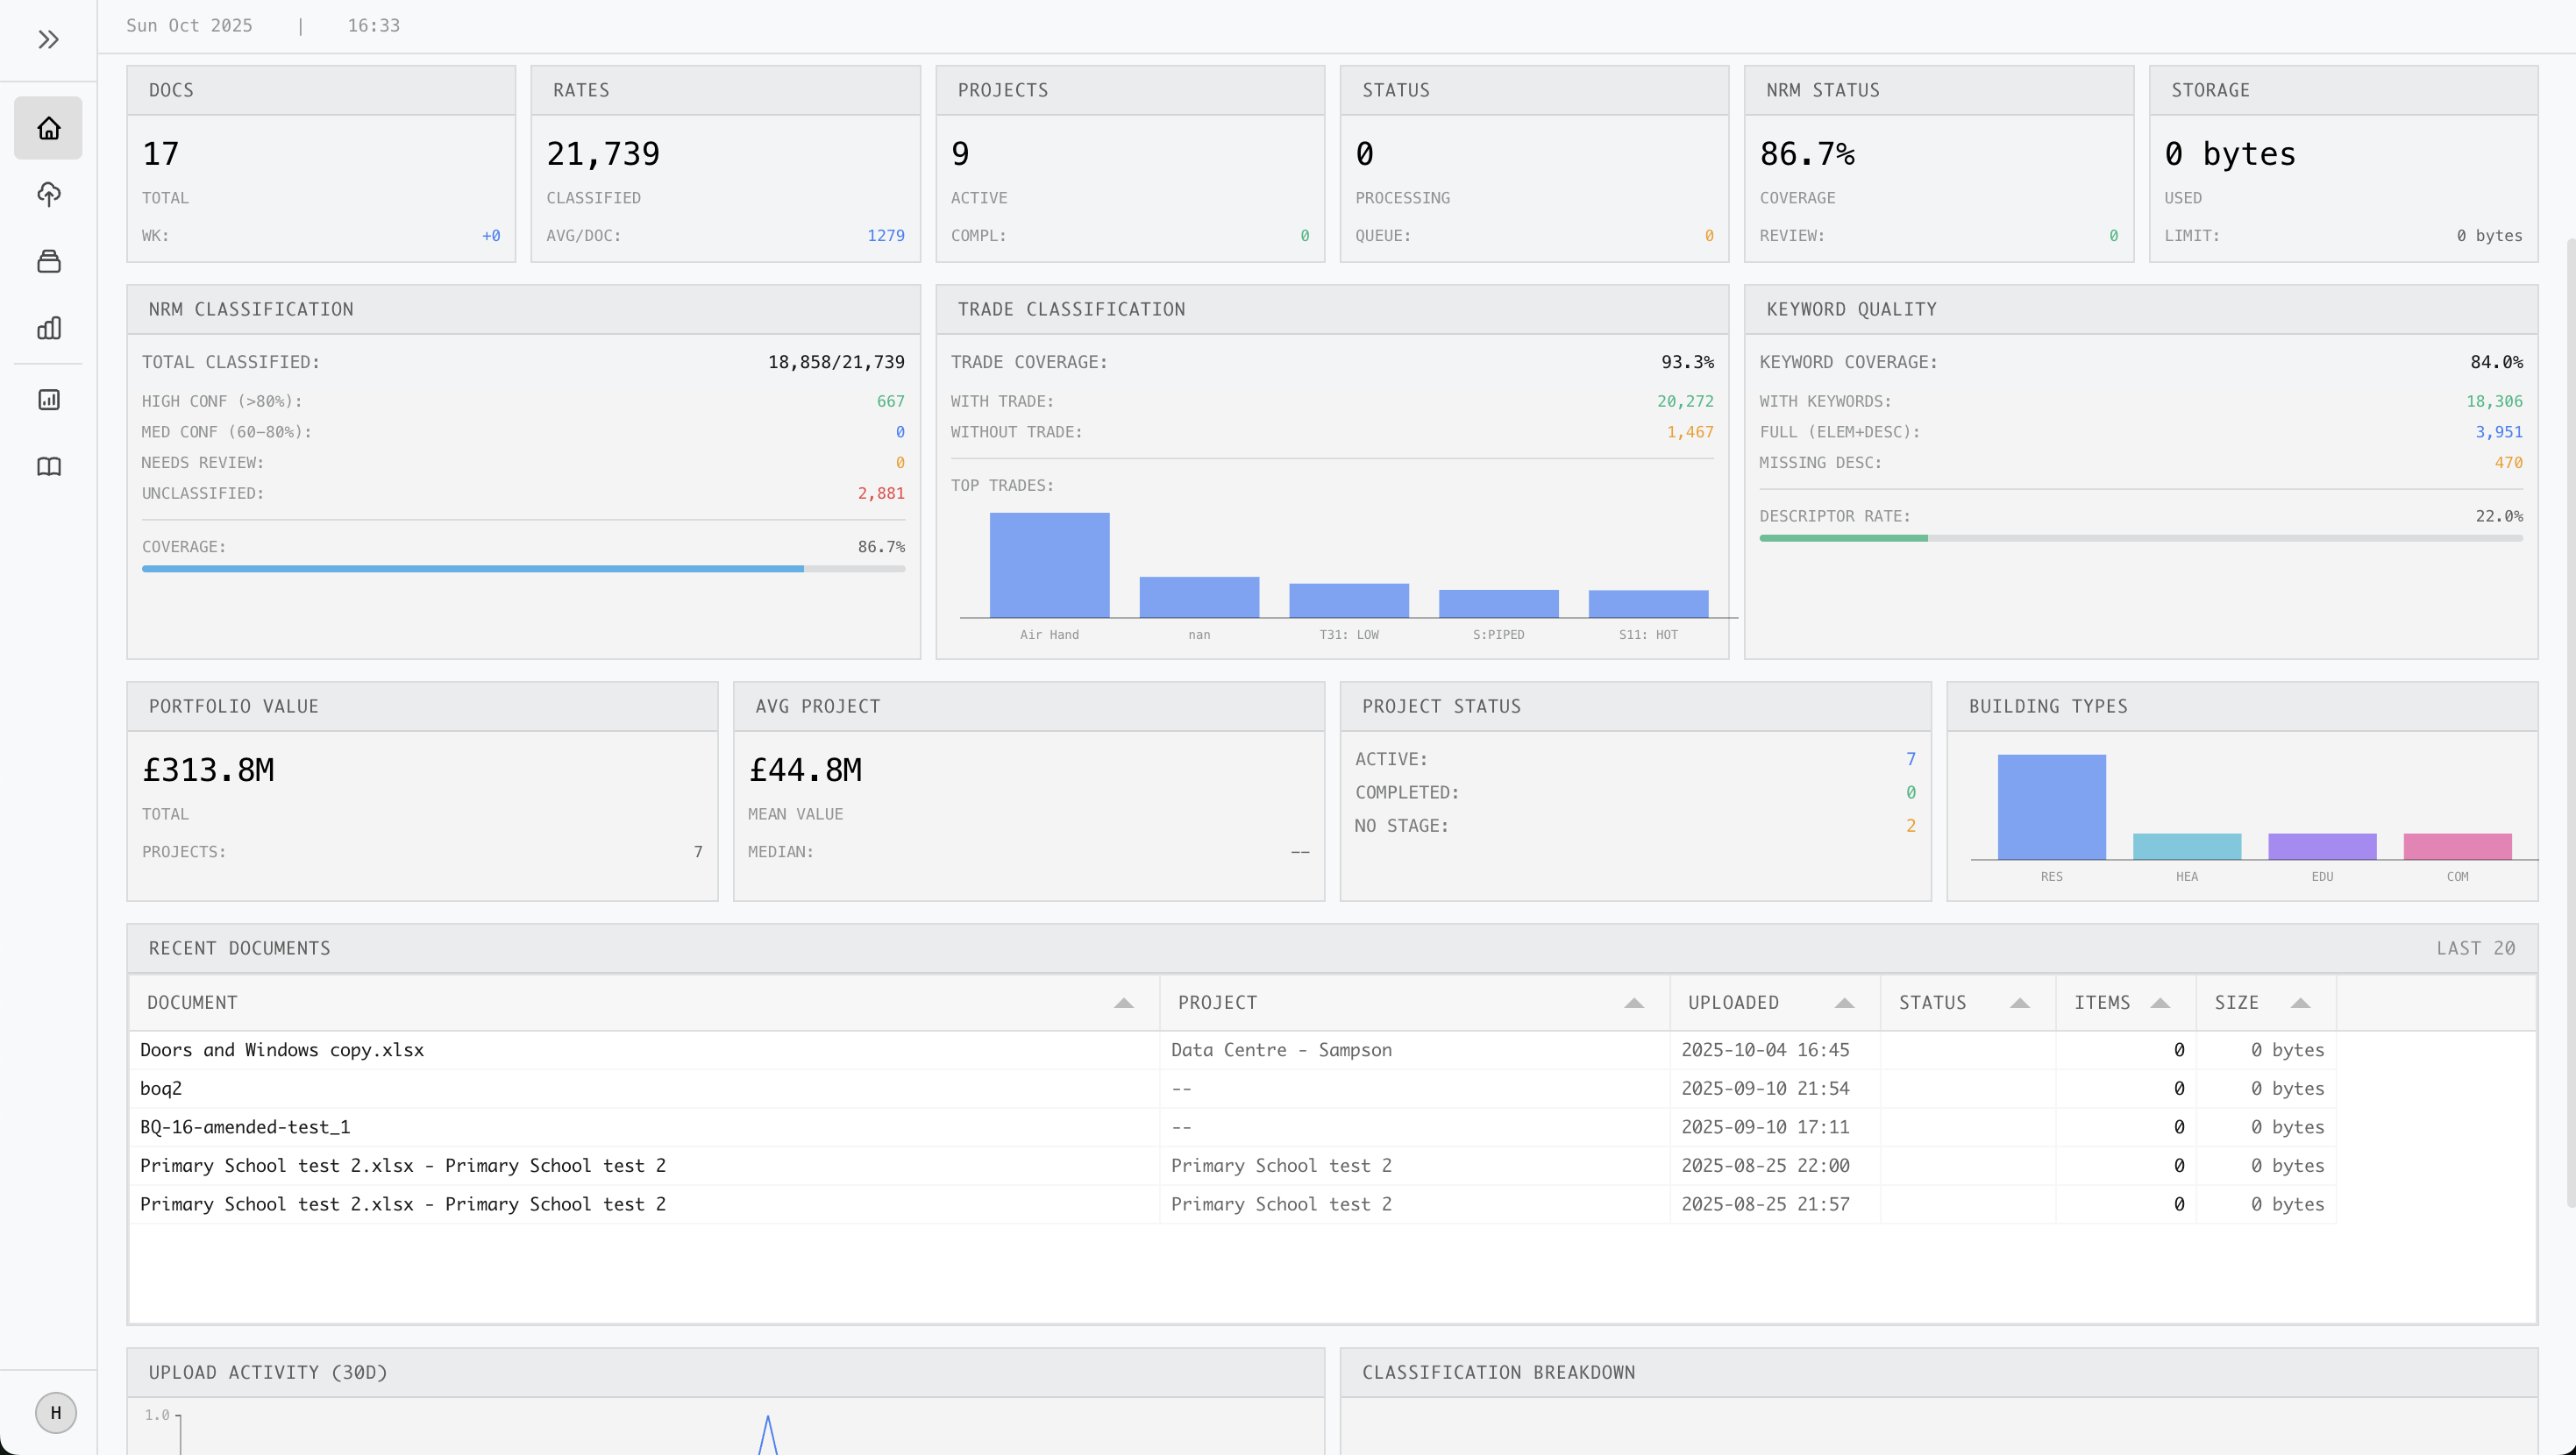
Project Dashboard
Get instant visibility into all your projects. View key metrics, recent uploads, and cost trends at a glance. Navigate from high-level KPIs to line-item detail in seconds.
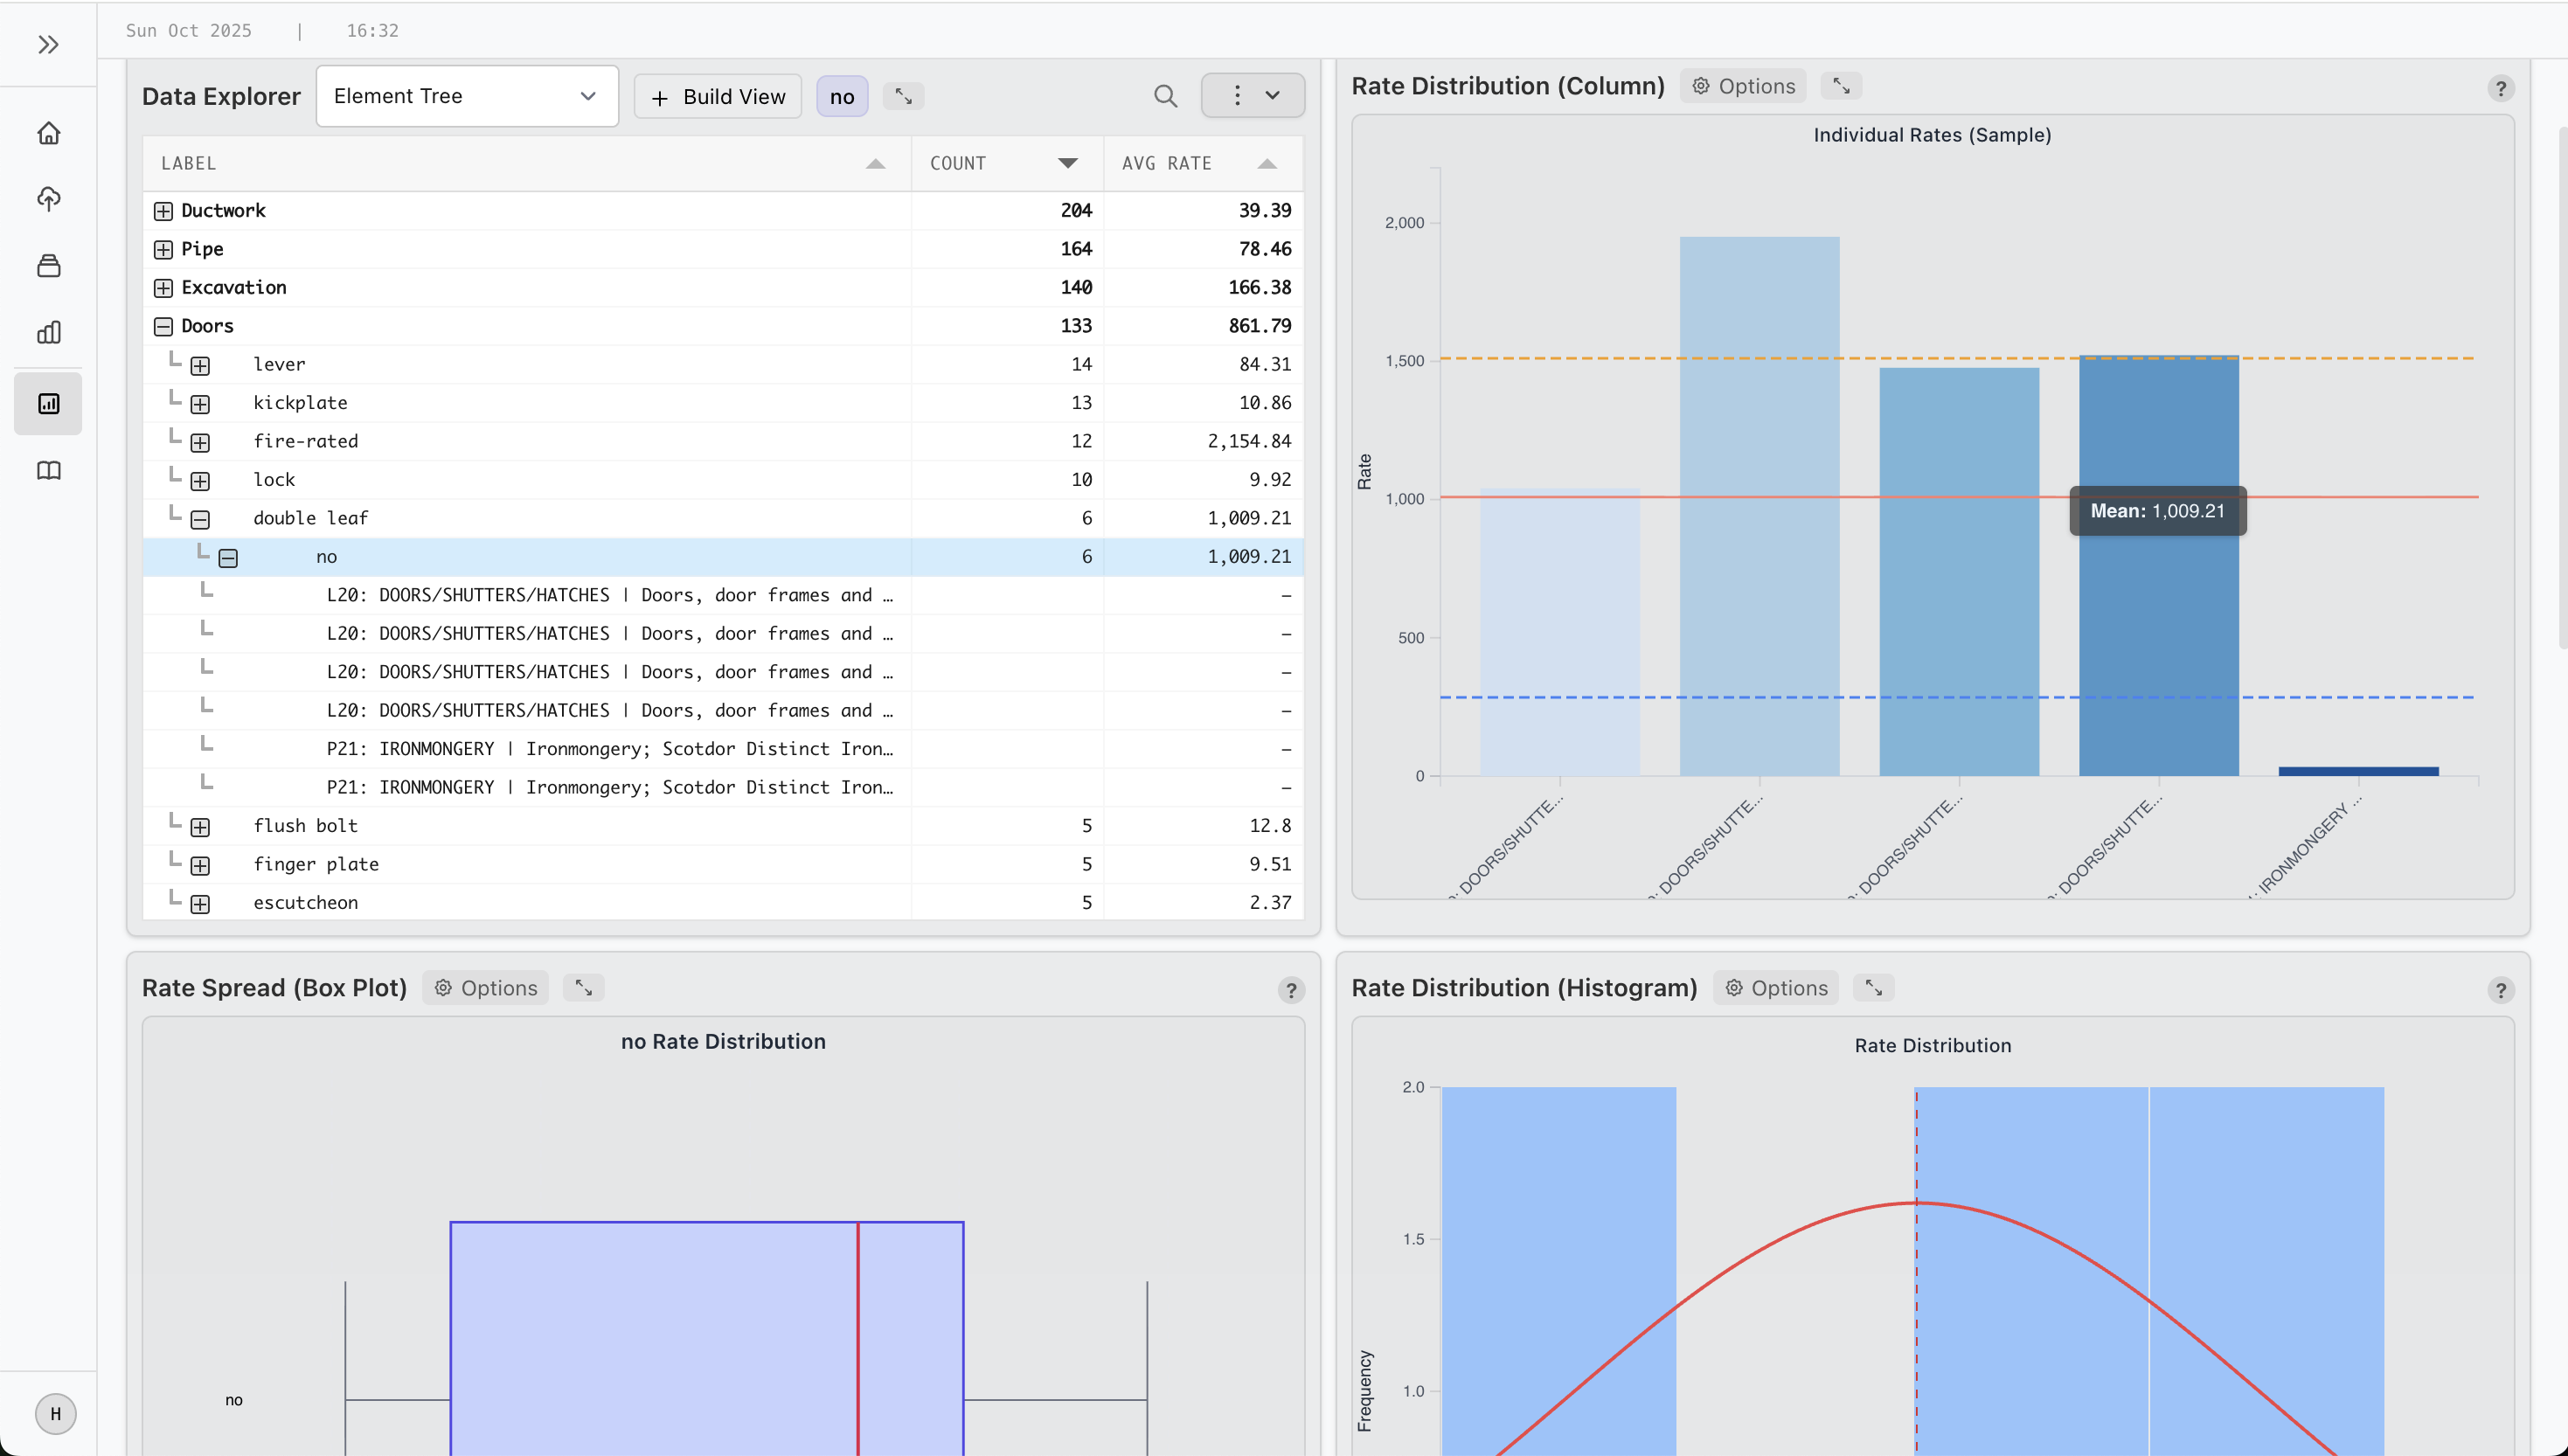
Rate Explorer
Benchmark any element across your entire project history. View distributions, identify outliers, and filter by project type, location, or date. Export findings directly to Excel.
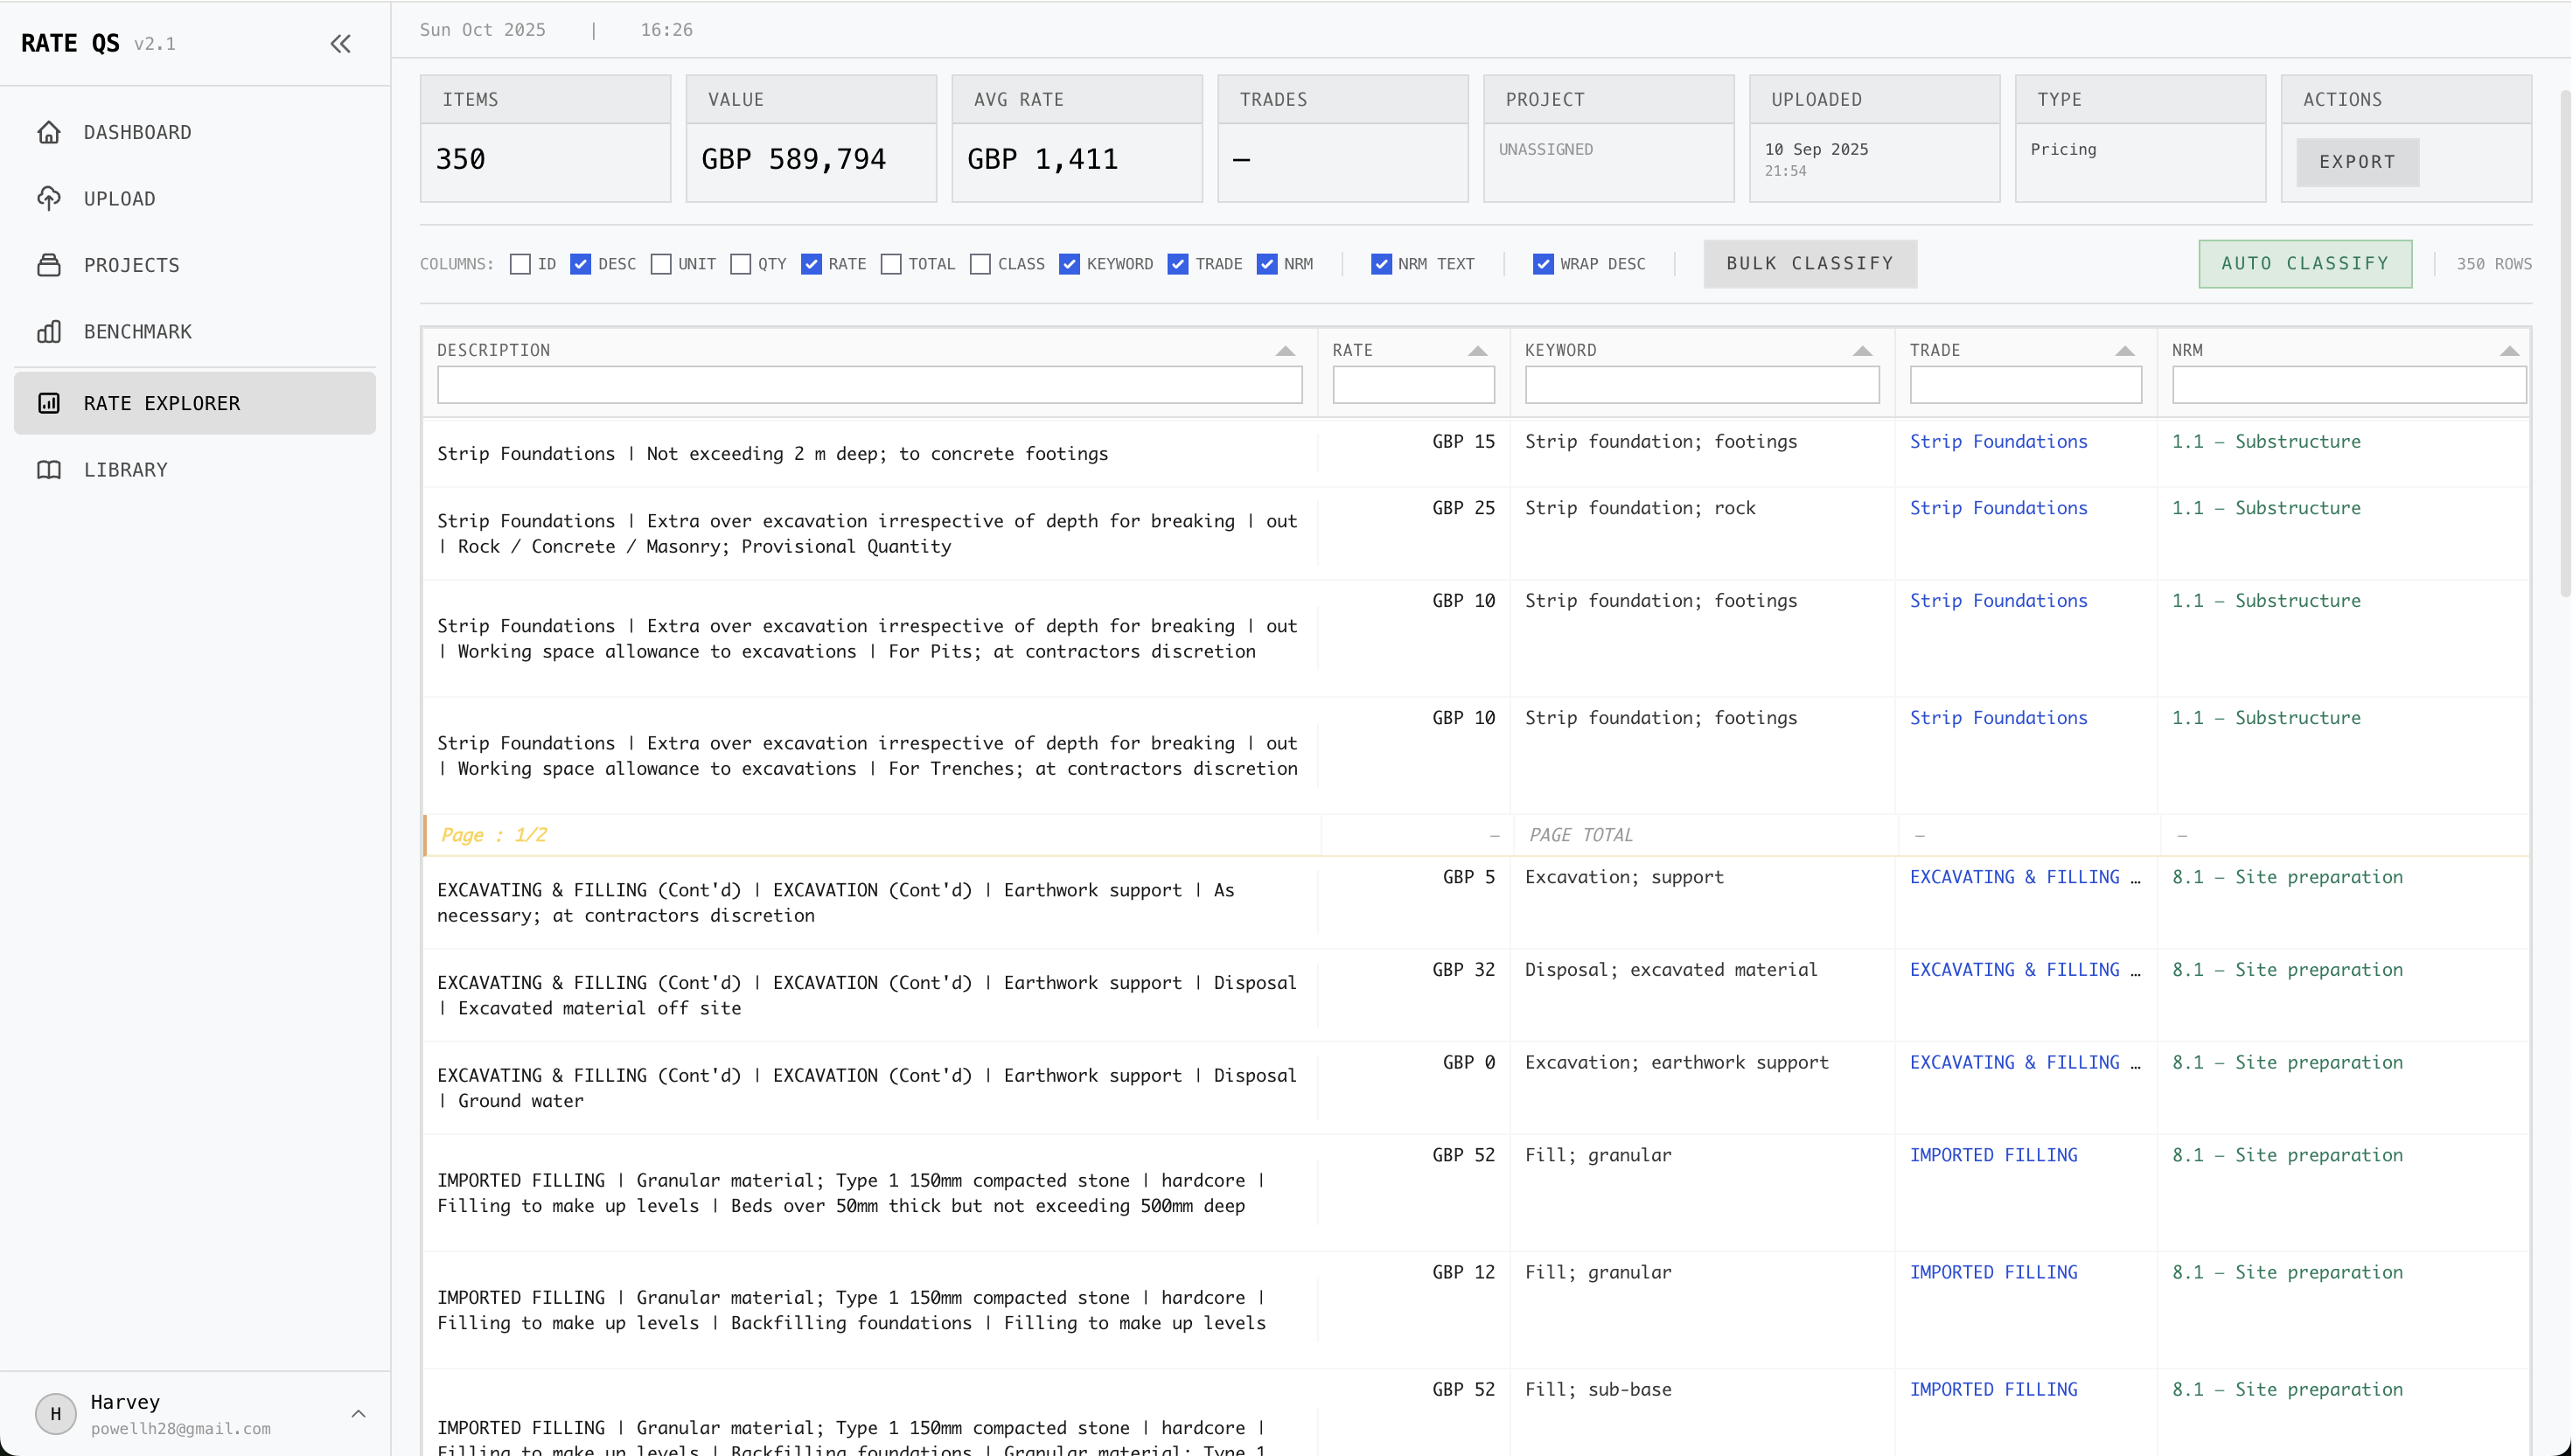
AI Classification Engine
Watch as AI automatically tags and classifies every line item with structured keywords. Review, edit, or approve classifications before they're added to your cost library.
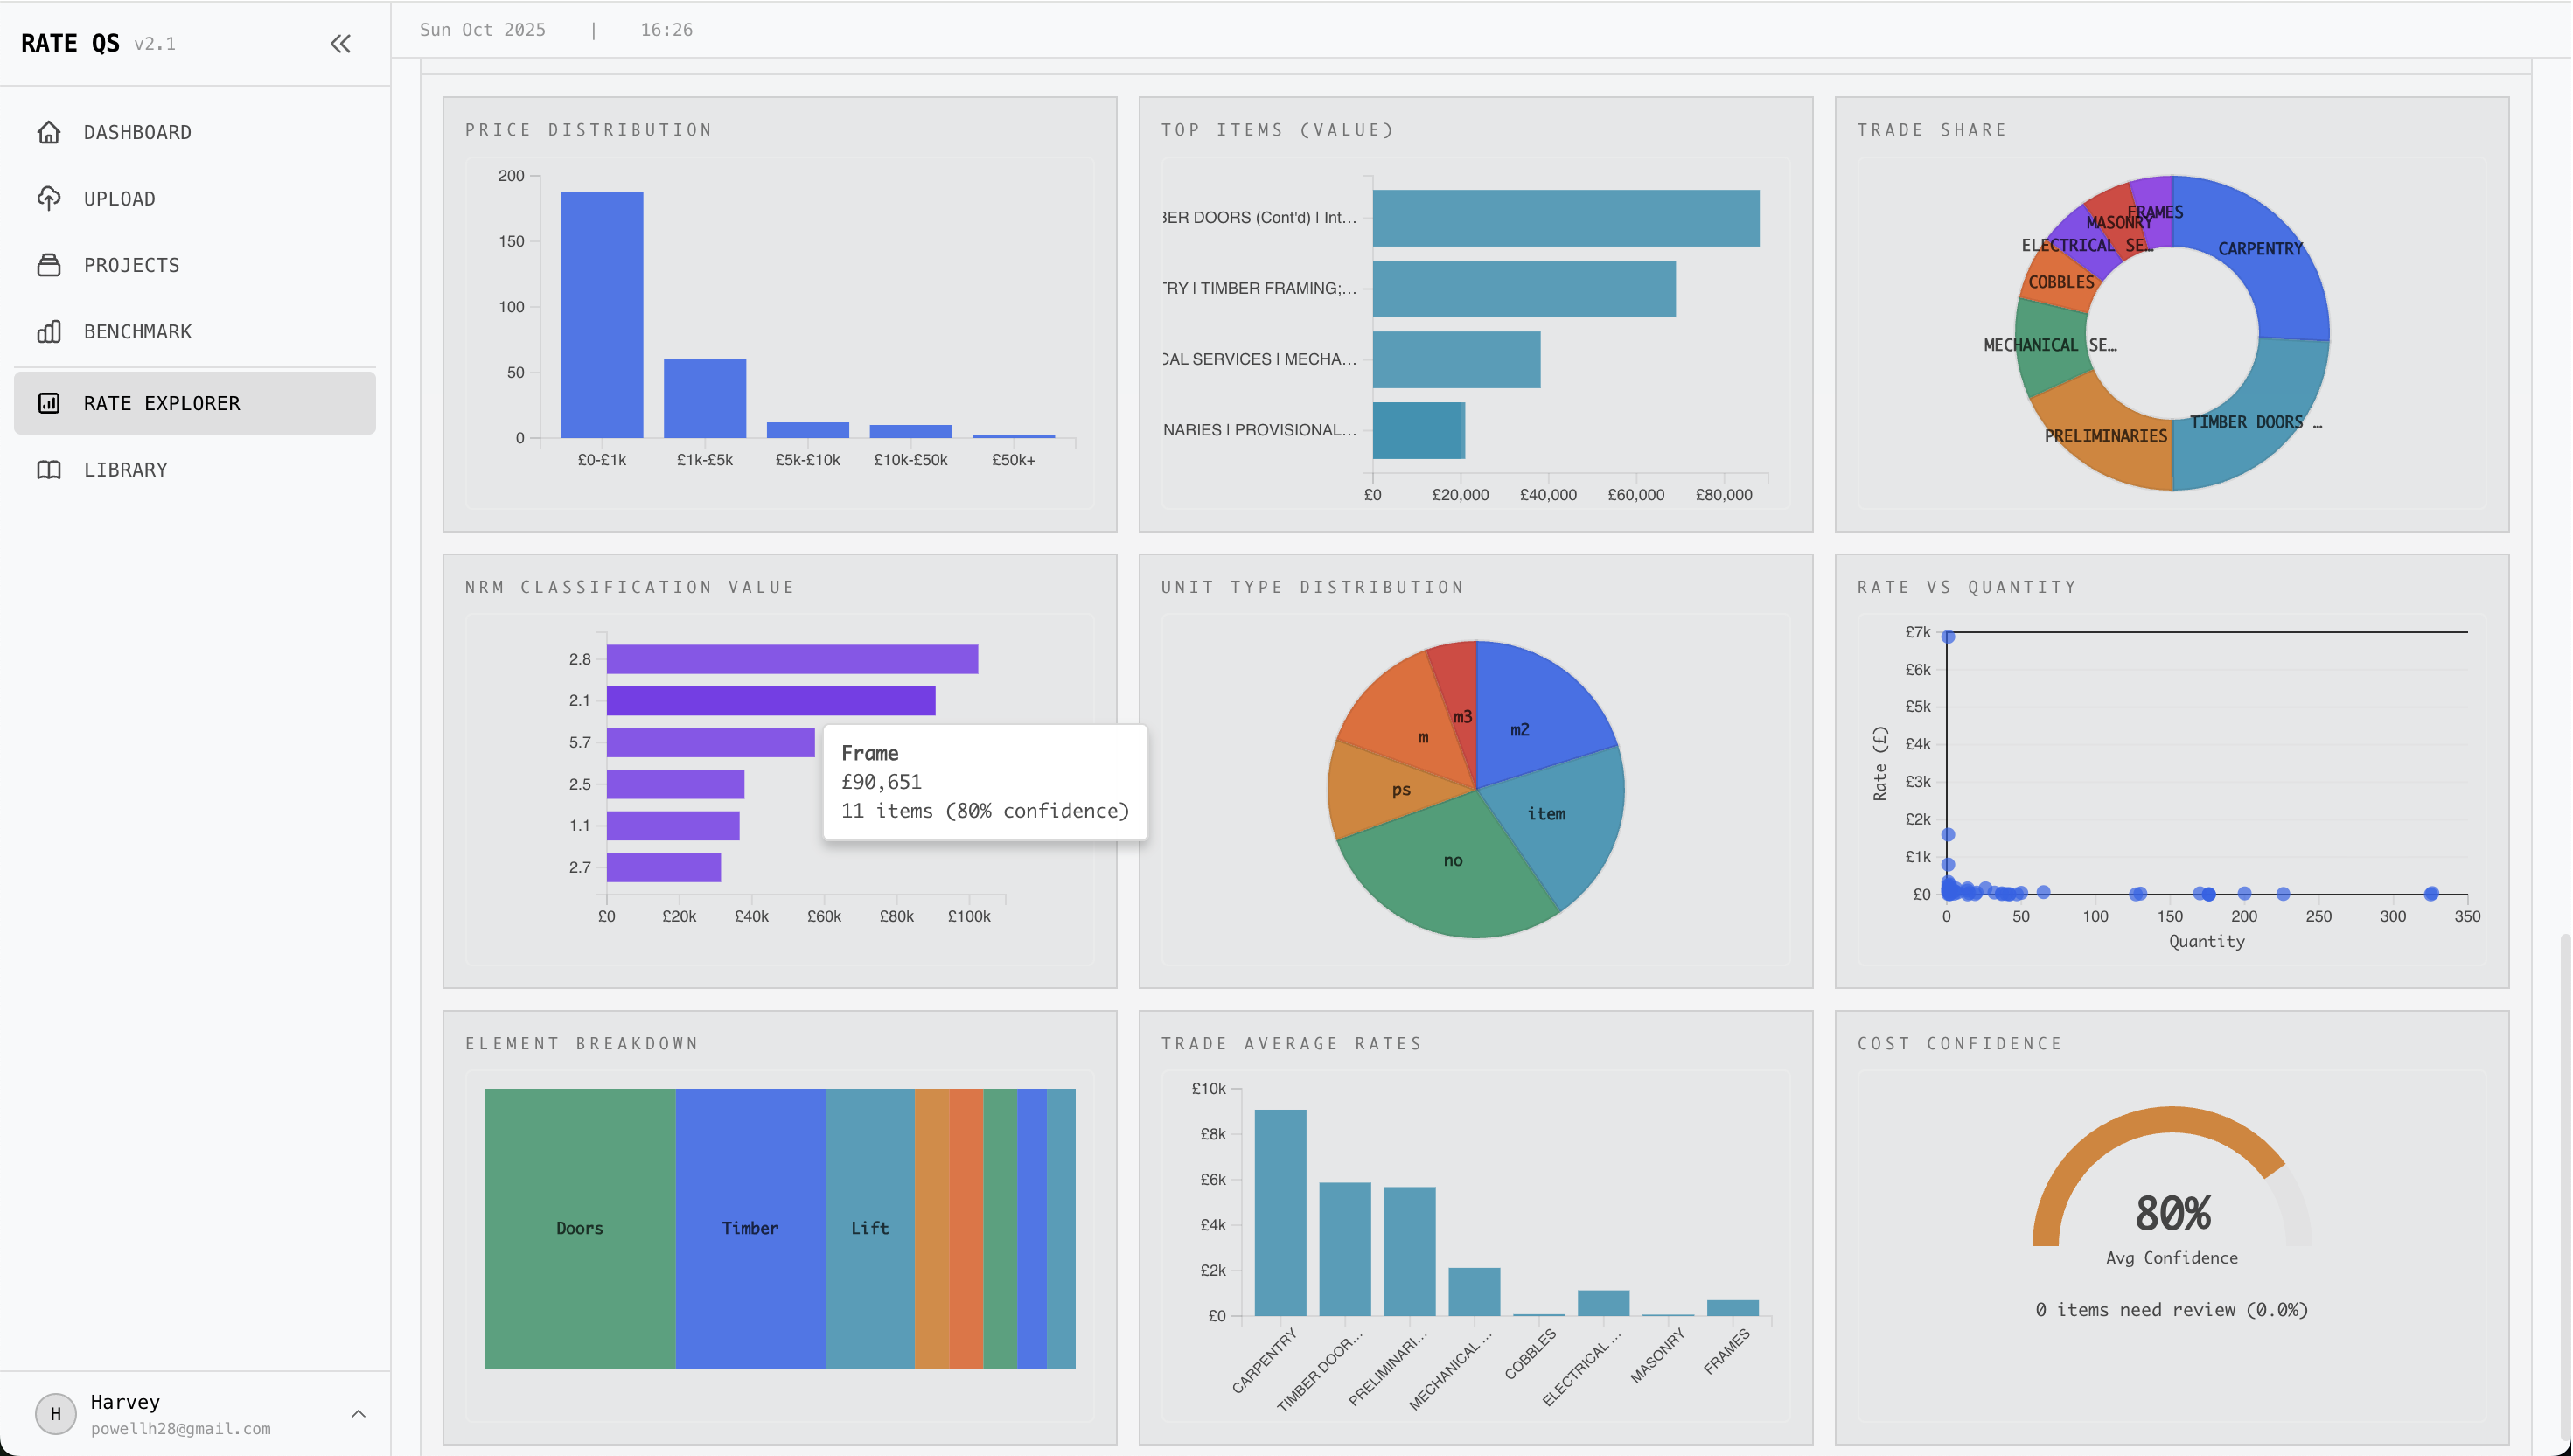
Visual Analytics
Interactive charts reveal cost trends, anomalies, and patterns across projects. Compare rates over time, by region, or by building type to make data-driven decisions.
Want to see the platform in action with your own data?
Start Your Free TrialOne Upload, Every RIBA Stage Covered
Your BoQ data transforms into stage-specific insights throughout the entire project lifecycle. Upload once, leverage everywhere.
Strategic Definition
High-level m² rates benchmarked across project types, sizes, and locations.
Cost Planning
Cross-project composite rates and granular unit rates at any level of detail.
Pre-tender Estimate
Individual BoQ line inspection for extremely accurate PTE pricing.
Contract & Variations
Contractor cost verification against industry trends and your own data.
Why Directors choose Rate QS
Five capabilities your competitors cannot match with spreadsheets or generic benchmarks.
Automated ingestion & classification
Upload any cost plan and Rate QS standardises descriptions in minutes, freeing senior QS time and eliminating transcription errors.
Result: consolidate years of project data without manual cleanup.Bottom-up benchmarking
Move from GBP /m^2 to individual trades instantly. Spot outliers and defend rates with a click.
Directors get actionable variance signals before sign-off.Private, secure rate library
Every insight sits inside your own encrypted environment. Nothing leaves your control.
One source of truth for the firm's pricing memory.Visual analytics built for QS
Distribution, trend, and anomaly views translate raw data into conversations partners can have with clients.
Use dashboards directly in pitch decks or tender reviews.Time savings & accuracy
Firms report dozens of hours saved per cost plan and faster detection of GBP 5k+ errors that previously hid in spreadsheets.
Reinvest time in strategy instead of data cleanup.Clear pricing for every firm
Pick the plan that matches your pipeline. No hidden fees, no forced onboarding. Upgrade when your team is ready to centralise more projects.
Free
1 user, no card required
- Upload up to 3 BoQs
- AI classification & rate library
- Baseline analytics dashboard
- Email support
Starter
Includes 3 users.
- 25 BoQs processed monthly
- Full rate explorer & benchmark charts
- Workflow integrations (Excel, CSV export)
- Priority email support
Growth
Includes 10 users plus advanced controls
- Unlimited BoQs
- API access & SSO
- Dedicated success manager
- Custom taxonomy management
What teams say
Proof points from pilots and early adopters across the UK.
"The AI classification is remarkably accurate. We consolidated three years of BOQs into our private library in a week."
Principal QS, Infrastructure
"Rate QS helped us benchmark projects in minutes and flagged a GBP 5k line item error before it left the office."
Director, Regional Consultancy
"I can challenge contractor rates on site with evidence from our own database, not someone else's averages."
Commercial Manager, Education
FAQs
Still clarifying? Here are the top questions from partners.
Ready to launch Rate QS?
Turn past project files into competitive intelligence today and give your next tender a data-backed edge.